The heads-up display
The command setup console transfers a copy of the local console from the controller's system memory into the unit's loadable inventory space, under #RLV/~NS/console/<version>, where <version> is the current edition of Companion, and ~NS is the RLV directory path prefix specified in the unit's OEM table. A new console will automatically be delivered if the wrong version is attached, and in many cases simply if it cannot be found during system start.
Opting out: Certain situations may make using the local console undesirable. To suppress activation, delete the _console-screen and _console-native objects from inside of the #RLV directory hierarchy, but keep the empty directories.
The Native Console is the new ATOS/CX HUD, which is also included with Companion starting in version 8.6. Unlike the older Screen Console Manager (described below), Native is designed for improved performance and maximum utilization of screen real estate.
These appear in the top left corner of the screen as needed. You can check all of them at once by clicking the unit's model badge in the bottom-right corner, which will also show the exact numeric values of each gauge for a short time and display the controller's main menu. The pop-up gauge icons are:
At the lower right corner of the screen is the main bar.
The icons below the bar are the system devices. Clicking on them (or using keyboard navigation—not yet implemented) will allow you to quickly access a pop-up menu for activating or checking the status of these devices as appropriate to their type.
At the far right is the model badge, which by default is the NS monogram logo. Clicking the model badge will bring up the system menu, similar to the controller's main menu.
Above the bar is often blank, but the numbers that appear here are the unit's integrity and ammunition status for supported ATOS weapons. Remember that units can only restore up to 90% of all damage taken using nanite-mediated auto-repair, so this will often asymptote toward 98 or a similar number. For full repairs, use a dedicated repair tool or station, such as the Asset Recovery Center (ARC).
The Native Console is designed for pixel-perfect display on 1080p and 2160p (4K) video feed monitors. To achieve the intended visual appearance, the unit must determine its viewer's viewport height. This is the number of pixels between the bottom of the menu bar and the top of the viewer's lower edge. For most viewers, the viewport includes the space behind any and all other interface buttons, which are rendered translucently.
For reference, a fully-maximized viewer under Windows 10 typically has a viewport height around 1008px on a 1080p monitor.
This is the calibration window:
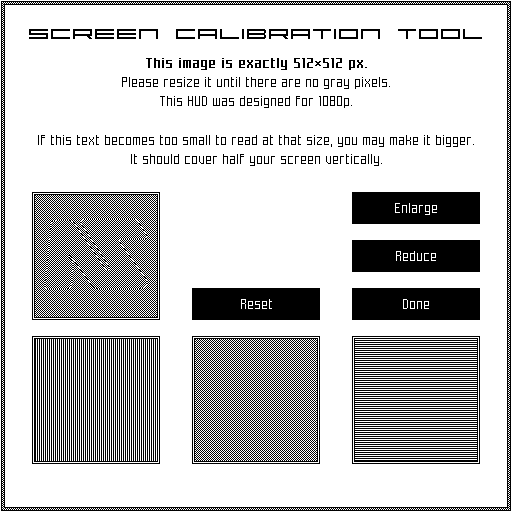
This image is completely monochromatic. When displayed correctly, no half-shaded pixels will be visible; that is, all of them will be either black or the unit's lighting color. On 4K monitors the unit should calibrate targeting half viewport height; e.g. for a viewport of 2000px, the calibration tool should display 1000px. The calibration tool's test patterns will not be pixel-exact on 4K displays, but they will exhibit uniform pixel interpolation, and other HUD assets will be shown in full, precise detail.
Calibration image is too small (notice gradients across striped portions):

Calibration image is too large (notice gradients across striped portions):

Calibration image at 200% size (correct for 4K):

Calibration image at 1023px (viewport too big for 4K):

Calibration image at 1025px (viewport too small for 4K):

If the unit finds the correct calibration size uncomfortable to look at, e.g. due to having a 1440p video feed, then the calibration should be adjusted until it is comfortable, despite the aesthetic shortcomings thereof.
The local console that came with version of Companion before 8.6 is called Screen Console Manager. Its primary purpose is to provide visual information to the unit about the unit's status through a bar at the bottom of its field of view. It additionally provides icons that the unit can access for adjusting a range of commonly-used features and configuration settings.
Adjustment: To configure SCM, edit the file _console-config inside of the controller's system memory. This will automatically be copied into the HUD if it is not identical to the HUD's current configuration, allowing customizations to persist through system updates. The _console-config file contains comments describing what each variable within it controls.

The main body of the SCM display is a bar that appears across the bottom of the unit's field of vision. This begins with a system-dependent identity badge on the left, followed by a series of segments. Each segment represents a device or system component, uniquely identifiable through their icons. These are described in the next section.
SCM may, from time to time, also display 'pop-out' sections for various activities, such as using an Akashic icon device, displaying tutorial information, or relating time-sensitive information from TESI pertaining to arousal levels (as shown above). For the most part, these interfaces are self-explanatory. Additional documentation for more complex interfaces, such as the TESI interface, is included with the products to which they pertain.
Opting out: Certain situations may make using the local console undesirable. To suppress activation, delete the _console-screen and _console-native objects from inside of the #RLV directory hierarchy, but keep the empty directories.
The Native Console
The Native Console is the new ATOS/CX HUD, which is also included with Companion starting in version 8.6. Unlike the older Screen Console Manager (described below), Native is designed for improved performance and maximum utilization of screen real estate.
Pop-up gauges
These appear in the top left corner of the screen as needed. You can check all of them at once by clicking the unit's model badge in the bottom-right corner, which will also show the exact numeric values of each gauge for a short time and display the controller's main menu. The pop-up gauge icons are:
| icon | meaning |
|---|---|
 | Charging: indicates the current power drain, as well as the fact that the unit is currently receiving power. Power drain shown reflects the last non-negative total power draw and may be inaccurate. |
 | Docked: indicates the unit is currently attached to a dock or wall outlet, which may provide power, repair, and more. (Not yet implemented) |
 | Not docked: indicates the unit is not currently attached to a dock or wall outlet. |
 | Heat: indicates the unit's current temperature, measured from 0° C (freezing) to 100° C (boiling). Values outside this range will be clamped to minimum and maximum values. |
 | Fan: indicates the rate of cooling, up to maximum fan speed or coolant pump speed, whichever is lower. |
 | Radiation: indicates the level of ambient ionizing radiation, from 0 cps to 100 cps. Values above this range are not great, but also not terrible. |
 | Battery: indicates the current level of stored power, as a fraction of the unit's total power cell capacity, not including the auxiliary capacitor. Newer versions also display this whenever there is a change in usage. |
 | Drain: indicates the current level of power usage, as a fraction of 780 W (the standard draw for a typical unit.) Values above this range are clamped. Abnormally low or negative values may result from charging; these are also clamped. |
 | Placeholder: not used. |
 | Shield level: not yet implemented. |
 | Module initialized signal detected: not yet implemented. |
 | Cortex status: not yet implemented. |
 | Cryolubricant status: not yet implemented. |
 | Environmental pressure: not yet implemented. |
 | Transceiver: not yet implemented. |
 | Capture the flag objective: not yet implemented. |
 | TESI status: not yet implemented. |
 | TESI status (release ready): not yet implemented. |
Main bar
At the lower right corner of the screen is the main bar.
The icons below the bar are the system devices. Clicking on them (or using keyboard navigation—not yet implemented) will allow you to quickly access a pop-up menu for activating or checking the status of these devices as appropriate to their type.
At the far right is the model badge, which by default is the NS monogram logo. Clicking the model badge will bring up the system menu, similar to the controller's main menu.
Above the bar is often blank, but the numbers that appear here are the unit's integrity and ammunition status for supported ATOS weapons. Remember that units can only restore up to 90% of all damage taken using nanite-mediated auto-repair, so this will often asymptote toward 98 or a similar number. For full repairs, use a dedicated repair tool or station, such as the Asset Recovery Center (ARC).
Calibration
The Native Console is designed for pixel-perfect display on 1080p and 2160p (4K) video feed monitors. To achieve the intended visual appearance, the unit must determine its viewer's viewport height. This is the number of pixels between the bottom of the menu bar and the top of the viewer's lower edge. For most viewers, the viewport includes the space behind any and all other interface buttons, which are rendered translucently.
For reference, a fully-maximized viewer under Windows 10 typically has a viewport height around 1008px on a 1080p monitor.
This is the calibration window:

This image is completely monochromatic. When displayed correctly, no half-shaded pixels will be visible; that is, all of them will be either black or the unit's lighting color. On 4K monitors the unit should calibrate targeting half viewport height; e.g. for a viewport of 2000px, the calibration tool should display 1000px. The calibration tool's test patterns will not be pixel-exact on 4K displays, but they will exhibit uniform pixel interpolation, and other HUD assets will be shown in full, precise detail.
Calibration image is too small (notice gradients across striped portions):

Calibration image is too large (notice gradients across striped portions):

Calibration image at 200% size (correct for 4K):

Calibration image at 1023px (viewport too big for 4K):

Calibration image at 1025px (viewport too small for 4K):

If the unit finds the correct calibration size uncomfortable to look at, e.g. due to having a 1440p video feed, then the calibration should be adjusted until it is comfortable, despite the aesthetic shortcomings thereof.
Screen Console Manager
The local console that came with version of Companion before 8.6 is called Screen Console Manager. Its primary purpose is to provide visual information to the unit about the unit's status through a bar at the bottom of its field of view. It additionally provides icons that the unit can access for adjusting a range of commonly-used features and configuration settings.
Adjustment: To configure SCM, edit the file _console-config inside of the controller's system memory. This will automatically be copied into the HUD if it is not identical to the HUD's current configuration, allowing customizations to persist through system updates. The _console-config file contains comments describing what each variable within it controls.

The main body of the SCM display is a bar that appears across the bottom of the unit's field of vision. This begins with a system-dependent identity badge on the left, followed by a series of segments. Each segment represents a device or system component, uniquely identifiable through their icons. These are described in the next section.
SCM may, from time to time, also display 'pop-out' sections for various activities, such as using an Akashic icon device, displaying tutorial information, or relating time-sensitive information from TESI pertaining to arousal levels (as shown above). For the most part, these interfaces are self-explanatory. Additional documentation for more complex interfaces, such as the TESI interface, is included with the products to which they pertain.
The system segment
     ... | Model badge This indicates the identity of the controller currently in use. If the model is for some reason unknown, then the "NS" monogram logo will be displayed instead. Clicking the model badge will open the main menu. |
|---|---|
| Applications Click this icon to open the applications menu. | |
| Cortex Click this icon to open the cortex menu. | |
| Devices Click this icon to open the devices menu. | |
| Security Click this icon to open the manage menu. | |
| Personas Click this icon to open the personas menu. | |
| Subsystems Click this icon to open the subsystems menu. |
Device segments
| Battery This segment is visible whenever a battery is installed. Click the icon to access the battery device directly, yielding a report of its current charge level, degradation status for generation 3 and later batteries (if applicable), and safety information. The segment also shows two gauges: | |
| Handles Multiple handle devices are shown condensed into a single icon. This icon will display both follow target (leash) information and carrier information by default. Click it to access the handle device's menu. If you have multiple handles, the button will access the first handle device that reported in, which may not necessarily be the handle currently being used to carry you. | |
| Shield The shield device shows two icons: a circle, at the left, and the 'properties' icon (also used for the subsystems menu on the system segment) on the right. Clicking the circle icon will immediately erect an active shield barrier, if supported by the shield device. If one is already active, it will be destroyed. Clicking the properties icon will show the shield capacitor's current charge status. These functions correspond to 'poke' and 'peek' respectively, and can be alternatively activated through the devices > shield menu with the 'access' and 'status' buttons. | |
| Collar If a collar device is installed, it will display follow information over its icon, superseding the handles icon. Click the collar icon to access the leashing menu. | |
| SuperBit Clicking the icon opens the SuperBit's internal menu. | |
| Akashic Icon Clicking the icon opens a special pop-out section for the icon device. Click the segment again to close it. |
ATOS segments
| ATOS/E system segment The system segment shows cooler status, system temperature, and system integrity status over its icon. Cooler speed is measured in RPM (revolutions per minute) for fans or CFM (cubic feet per minute) for liquid cooling. See Combat, damage, and repair for more information. | |
| ATOS/E weapon segment The weapon segment is readily distinguished from the system segment because it includes the weapon's name in the text over the icon. Like the system section, it also relates temperature information, but the top gauge indicates clip status (shots remaining/clip size) instead. The weapon segment is only visible when a weapon is drawn. Only one can be active at a time. |